At my company, we have IO issues because of the SAN. I know this because the SAN administrator and I have been talking about the SQL Server IO latency.

But what if I didn’t know the SAN had an issue? Just saying SAN is slow is like saying your database is slow. OK, why do you think that? Where should I look and in what order? What proof do I need to have?
Steps to verify there is an issue:
“Emergency Slow”
Query the SQL Server Error Log from SQL Server Management Studio
EXEC sys.xp_readerrorlog 0,1, N’taking longer than 15 seconds’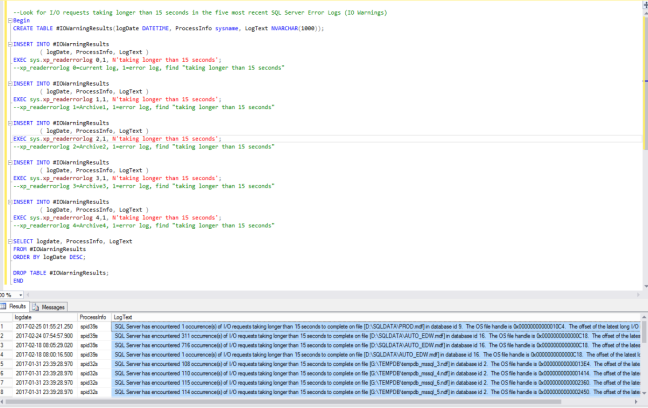
If you find an entry in the SQL Server error log for the days and times in question, run/don’t walk to your SAN administrator for help.
Problem is you need more data to give the SAN admin.
To find out more on how to run the sys.xp_readerrorlog command read: Reading the SQL Server log files using TSQL by Greg Robidoux
https://www.mssqltips.com/sqlservertip/1476/reading-the-sql-server-log-files-using-tsql/
“Semi-slow”
So there were no messages stating “I/O requests taking longer than 15 seconds. What is the next step?
Data to gather and analyze
- Sys.dm_io_virtual_file_stats –This view contains all the read and writes since the SQL Server was started. Take a sample, write to a temp table, then in 5 min calculate the difference between two samples, what was the latency? Analyze it.
The query below will calculate the current latency within the 5 minutes you run the script. This script will run 5 minutes.
SELECT
GETDATE() AS collection_time,
d.name AS [Database],
f.physical_name AS [File],
(fs.num_of_bytes_read / 1024.0 / 1024.0) [Total MB Read],
(fs.num_of_bytes_written / 1024.0 / 1024.0) AS [Total MB Written],
(fs.num_of_reads + fs.num_of_writes) AS [Total I/O Count],
fs.io_stall AS [Total I/O Wait Time (ms)],
fs.size_on_disk_bytes / 1024 / 1024 AS [Size (MB)]
INTO #past_coll_time
FROM sys.dm_io_virtual_file_stats(default, default) AS fs
INNER JOIN sys.master_files f
ON fs.database_id = f.database_id
AND fs.file_id = f.file_id
INNER JOIN sys.databases d
ON d.database_id = fs.database_id;

WAITFOR DELAY '00:05:00';

SELECT
GETDATE() AS collection_time,
d.name AS [Database],
f.physical_name AS [File],
(fs.num_of_bytes_read / 1024.0 / 1024.0) [Total MB Read],
(fs.num_of_bytes_written / 1024.0 / 1024.0) AS [Total MB Written],
(fs.num_of_reads + fs.num_of_writes) AS [Total I/O Count],
fs.io_stall AS [Total I/O Wait Time (ms)],
fs.size_on_disk_bytes / 1024 / 1024 AS [Size (MB)]
INTO #curr_coll_time
FROM sys.dm_io_virtual_file_stats(default, default) AS fs
INNER JOIN sys.master_files f
ON fs.database_id = f.database_id
AND fs.file_id = f.file_id
INNER JOIN sys.databases d
ON d.database_id = fs.database_id;

SELECT
cur.[Database],
cur.[File] AS [File Name],
CONVERT (numeric(28,1), (cur.[Total MB Read] - prev.[Total MB Read])
* 1000 /DATEDIFF (millisecond, prev.collection_time, cur.collection_time))
AS [MB/sec Read],
CONVERT (numeric(28,1), (cur.[Total MB Written] - prev.[Total MB Written])
* 1000 / DATEDIFF (millisecond, prev.collection_time, cur.collection_time))
AS [MB/sec Written],
CONVERT (numeric(28,1), (cur.[Total I/O Wait Time (ms)]
- prev.[Total I/O Wait Time (ms)]) ) AS [Total IO Stall (ms)],

-- protect from div-by-zero

CASE
WHEN (cur.[Total I/O Count] - prev.[Total I/O Count]) = 0 THEN 0
ELSE
(cur.[Total I/O Wait Time (ms)] - prev.[Total I/O Wait Time (ms)])
/ (cur.[Total I/O Count] - prev.[Total I/O Count])
END AS [Response Time (ms per transaction)]
INTO #response_time_cal
FROM #curr_coll_time AS cur
INNER JOIN #past_coll_time AS prev
ON prev.[Database] = cur.[Database]
AND prev.[File] = cur.[File];

SELECT *
FROM #response_time_cal
WHERE [Response Time (ms per transaction)] > 0;

DROP table #response_time_cal;

DROP TABLE #curr_coll_time;

DROP TABLE #past_coll_time;
Is the latency above acceptable thresholds? MS published Storage latency numbers, some latency is acceptable. From Microsoft’s “Analyzing I/O Characteristics and Sizing Storage Systems for SQL Server Database Applications” back from 2008 MS Advisory team.
Data file latency: <= 20 ms (OLTP) <=30 ms (DW)
Log file files: <= 5 ms
There are a bunch of free scripts to sample this, if you don’t feel like writing your own. Here are two:
What analysis should you do before going to the SAN group?
https://blog.sqlauthority.com/2015/05/15/sql-server-warning-sql-server-has-encountered-n-occurrences-of-io-requests-taking-longer-than-15-seconds/
Pinal recommends, “Here are the thing which a DBA should do before going to hardware team.
- Note the pattern of the message. If they are logged at any specific time? Check if there is any scheduled maintenance job is running at the same time? Rebuild index and other IO intensive tasks would perform a lot of IO and disk may report slowness at that time.
- Check Event log (system and application) and check if there are any disk related error or warning messages.
- Keep monitoring sysprocesses and check for waits which are happening for SPIDs. If the disk is slow all the times then you should see waits of PAGEIOLATCH, WRITELOG or LOGBUFFER with high wait time. Refer my earlier blogs.
- Capture disk related data using performance monitor (start > run > perfmon) for extended amount of time and have a look at counters. You should look at the performance counters related to storage performance to evaluate whether the numbers you are seeing are expected and within reasonable bounds. (See Table 3 I/O related performance counters and their meanings below for counters to review)
- Make sure latest Windows patch has been applied to avoid any known issues with windows itself.
- Once basics have been verified and we have confirmed that we are seeing symptoms of slow response from disk, hardware team need to be engaged for further investigation.
Gather disk latency counters from Windows Performance monitor
Very important to show the SAN or Sys Admin to prove your point.
From https://technet.microsoft.com/library/Cc966412
“Monitoring I/O Performance Using System Monitor
The Windows System Monitor tool can be used to get detailed information about I/O performance on a system. Table 3 contains detailed information specific to the I/O counters you should consider monitoring and how to interpret them. These counters can be captured by monitoring either Physical or Logical Disk counters. The choice of which object to use should be based on the specific storage configuration that is being tested.
Table 3 I/O related performance counters and their meanings
| Performance Monitor Counter |
Description |
| Disk Reads/sec & Disk Writes/sec |
Number of I/Os per second (IOPs) being issued against a particular disk or volume. This number varies based on the size of I/Os issued. Consult the hardware vendor for an estimation of the number of I/Os per second support per spindle on their particular hardware. Perfmon captures the total number of individual disk IO requests completed over a period of one second |
| Average Disk/sec Read & Average Disk/sec Write |
Measure of disk latency. Lower values are better but this can vary and is dependent on the size and nature of the I/Os being issued. Numbers also vary across different storage configurations (cache size/utilization can impact this greatly).
On well-tuned I/O subsystems, ideal values would be:
· 1–5 ms for Log (ideally 1 ms on arrays with cache)
· 4–20 ms for Data on OLTP systems (ideally 10 ms or less)
· 30 ms or less on DSS (decision support system) type. Latencies here can vary significantly depending on the number of simultaneous queries being issued against the system. Sustained values of more than this when the total throughput is less than expected should be investigated.
Consider these in combination with what is normal for your particular system.
Make sure to monitor disk latencies for trend analysis. The number of I/Os and latency specific to SQL Server data files can be found by using the sys.dm_io_virtual_file_stats dynamic management view in SQL Server 2005. |
| Average Disk Bytes/Read & Average Disk Bytes/Write |
Size of I/Os being issued. This value may impact disk latency and larger I/Os may result in slightly higher latency. When used to monitor SQL Server, this will tell you the average size of the I/Os SQL Server is issuing. Displays the average size of the individual disk requests (IO size) in bytes, for the capture interval. Example: If the system had ninety nine IO requests of 8K and one IO request of 2048K, the average will be 28.4K. Calculation = (8k*99) + (1*2048k) / 100. |
| Average Disk Queue Length |
Average number of outstanding I/O requests. The general rule of thumb is <=2 per spindle but this may be hard to measure due to storage virtualization, differences in RAID level between configurations, and so on.
Focus on higher than average disk queue length in combination with higher than average disk latencies. This combination could indicate that the storage array cache is being over utilized or spindle sharing with other applications is impacting performance. |
| Disk Read Bytes/sec & Disk Write Bytes/sec |
Measure of the total bandwidth for a particular disk or LUN. Perfmon captures the total number of bytes sent to the disk (write) and retrieved from the disk (read) over a period of one second. |
It is important to note that while System Monitor provides a very accurate picture of your I/O subsystem’s current performance, it may not provide enough information to successfully resolve all I/O performance issues in SAN environments. System Monitor can be used to diagnose I/O performance problems; however, resolution may lie in the storage array or in the HBA driver level, which can be more challenging to diagnose.”
Verify/Prove the issue is not at the network level
- \Network Interface(*)\Bytes Total/sec – The percentage of network utilization is calculated by multiplying Bytes Total/sec by 8 to convert it to bits, multiply the result by 100, then divide by the network adapter’s current bandwidth. Use the following thresholds to evaluate network bandwidth utilization:
- Less than 40% of the interface consumed = Healthy
- 41%-64% of the interface consumed = Monitor or Caution
- 65-100% of the interface consumed = Critical, performance will be adversely affected
- 40,522,960*8= 324,183,680*100 = 32,418,368,000/1,000,000,000=32%
- \Network Interface(*)\Output Queue Length – The output queue length measures the number of threads waiting on the network adapter. If there are more than 2 threads waiting on the network adapter, then the network may be a bottleneck. Common causes of this are poor network latency and/or high collision rates on the network. Use the following thresholds to evaluate output queue length:
- 0 = Healthy
- 1-2 = Monitor or Caution
- Greater than 2 = Critical, performance will be adversely affected.
Network Fixes:
Ensure that the network adapters for all computers (physical and virtual) in the solution are configured to use the same value for maximum transmission unit (MTU).
For more information about configuring the MTU value see “Appendix A: TCP/IP Configuration Parameters” at http://go.microsoft.com/fwlink/?LinkId=113716.
If an output queue length of 2 or more is measured, consider adding one or more physical network adapters to the physical computer that hosts the virtual machines and bind the network adapters used by the guest operating systems to these physical network adapters.
How to engage the SAN Admin?
- Disk latency/storage latency. How much am I waiting on storage? Get metrics to show evidence about where the disk latency is causing database issues. How much is latency hurting performance.
- Here is the impact/slow down on work load we are seeing
- What are your options? Present a range of options on how to fix. Do you really need faster storage?
- Per Kendra Little, “Make all the data available to the storage admins, but only give the storage admin the summary.”
Possible Reasons:
- Could it be a cable not connected?
- It could indicate a poor disk subsystem, a misconfiguration, or a problem with the host bus adapter (HBA) driver or hardware connecting the server and SAN.
- It could also indicate fragmentation, excessive I/O requests not being handled properly by the disk, or data files not optimally placed on the disk.
- Was there maintenance?
- Faulty component?
- Check if the file moved to a new tier of storage?
- Etc…
Options to fix:
- Are we suffering read latency against data files? If high, how much memory have we given the SQL Server? Is it possible to add more memory? Much cheaper option than paying for san disk.
- Adding memory frequently reduces read latency from storage for data files.
- Can you improve the workload by adding an index? Check the indexes in the database. Have we created indexes for the most frequent queries? Optimize and reduce the amount of data SQL Server needs to read. Asking a lot less from storage and faster. Better and cheaper then speeding up storage.
- Heavy write latency to transaction logs can usually only be sped up either by speeding up storage or (sometimes) changing application patterns if you’ve got a lot of tiny small commits.
- If there is a write latency greater than 5ms, look at the processes, jobs, and queries that are running in SQL Server. Sp_whoisactive
References:
Kendra Little – https://www.littlekendra.com/2016/06/16/outside-the-big-san-box-analyzing-storage-and-san-latency-in-sql-server-dear-sql-dba/
Pinal Dave- https://blog.sqlauthority.com/2015/05/15/sql-server-warning-sql-server-has-encountered-n-occurrences-of-io-requests-taking-longer-than-15-seconds/
Greg Robidoux – https://www.mssqltips.com/sqlservertip/1476/reading-the-sql-server-log-files-using-tsql/
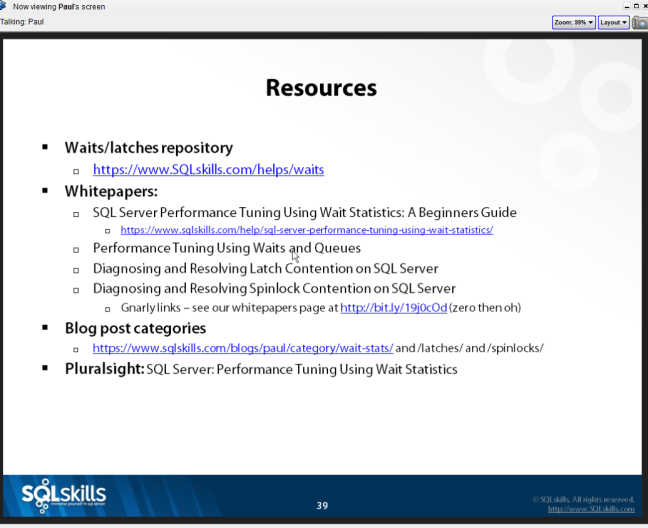
Paul Randal’s script from SQLSkills
sp_AskBrent from Brent Ozar Unlimited
Microsoft – https://technet.microsoft.com/library/Cc966412
Microsoft – “Analyzing I/O Characteristics and Sizing Storage Systems for SQL Server Database Applications”
Microsoft – http://go.microsoft.com/fwlink/?LinkId=113716